Analytics & rankings
for every student.
Real-time leaderboards, section-wise accuracy, time analysis, and performance trends. See who is improving, who is struggling, and where to focus your teaching next - all from one dashboard.
How it works
Every exam feeds
your analytics.
As students complete exams, MegaExams automatically builds a performance picture - rankings across exams, accuracy by subject, time spent per question, and improvement trends. You don't configure anything. Just create exams and the insights appear.
What you get
Insights that actually help you teach
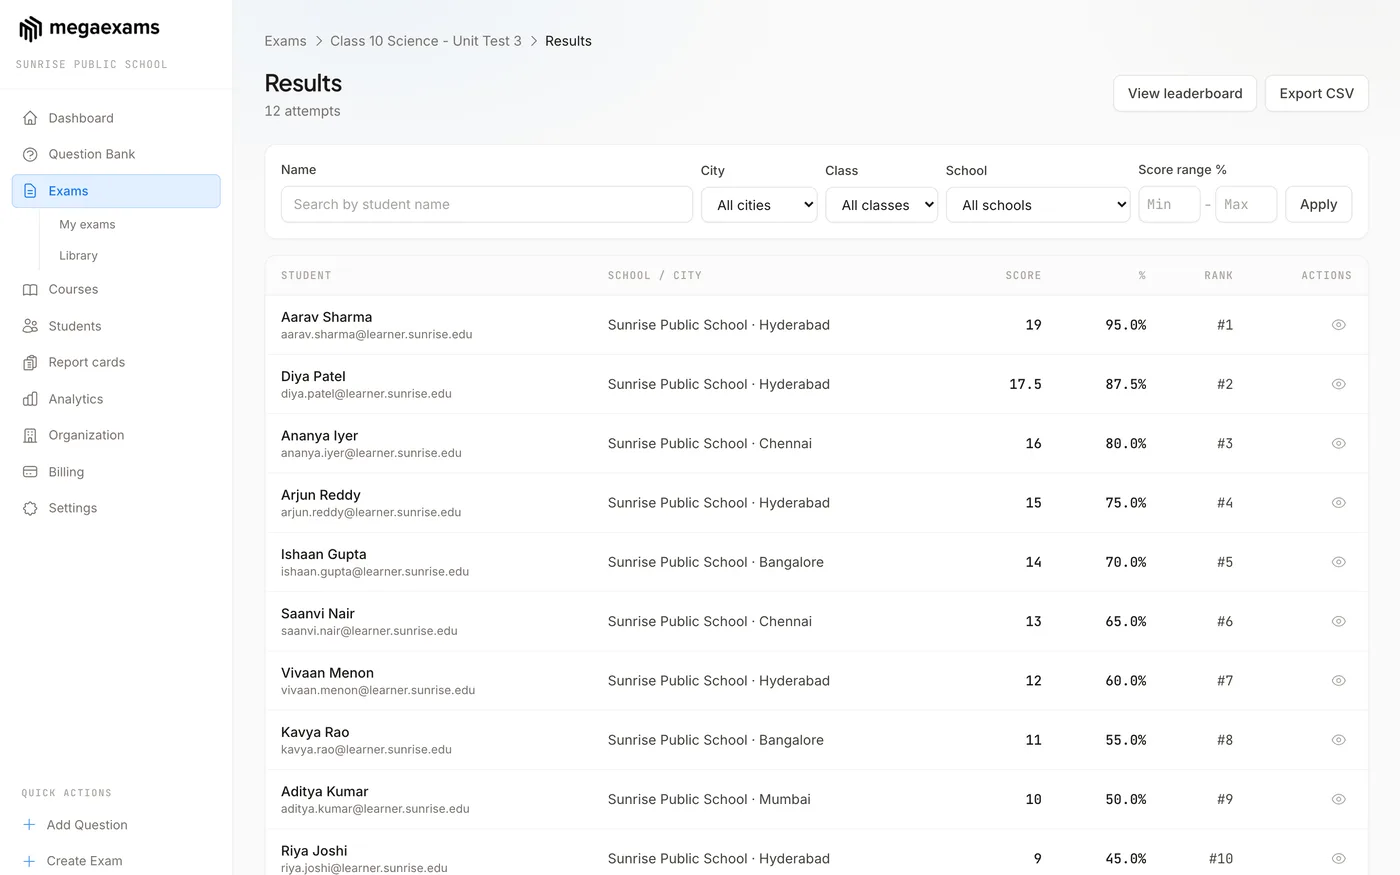
Live Leaderboards
Rankings update as students submit. See top performers, score distribution, and percentile ranks. Filter by exam, batch, or date range.
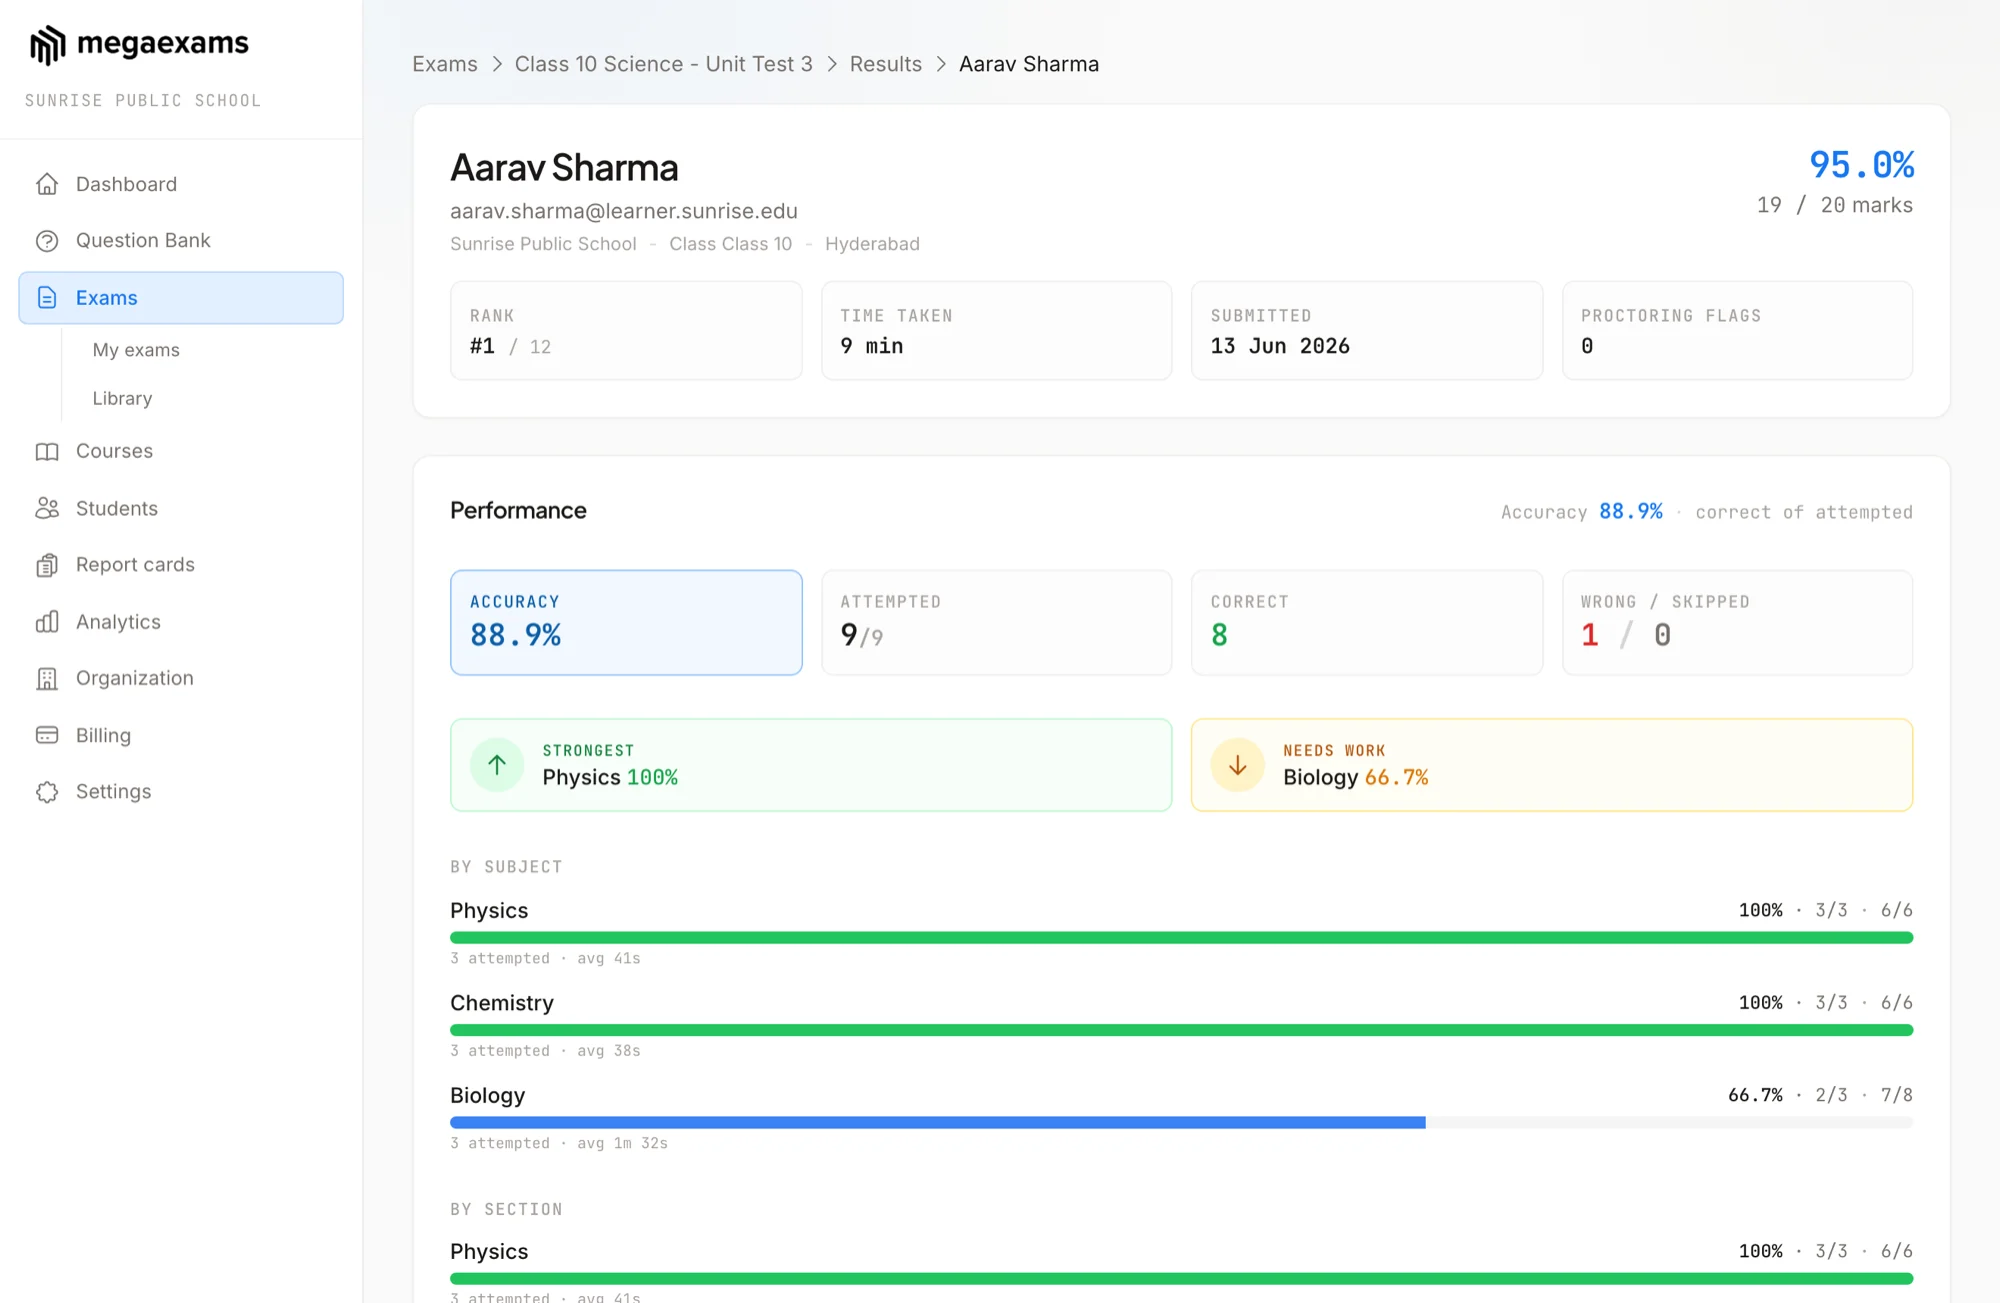
Section-wise Accuracy
Break performance down by Physics, Chemistry, Maths - or any subject. Identify which topics students are strong in and where they need more practice.
Performance Trends
Track how each student improves over weeks and months. Spot students who are slipping before it becomes a problem. Share progress reports with parents.
Deep insights
Every metric you need
Percentile Ranks
Every student sees their percentile rank - just like JEE and NEET results. Helps students understand where they stand relative to peers.
Question-level Analysis
See which questions most students got wrong. Identify confusing questions, topics that need re-teaching, or answer key errors.
Time per Question
Know how long students spent on each question. Find questions that consumed too much time and adjust difficulty accordingly.
Batch Comparison
Compare performance across batches. See which batch is ahead, which needs more attention, and how they compare on the same exam.
Exportable Reports
Export analytics as CSV or PDF. Use them for parent-teacher meetings, internal reviews, or student counseling sessions.
Improvement Tracking
See score trends across multiple exams. Students who take 5+ exams get a clear improvement graph showing their trajectory.
Common questions
Frequently asked questions
See where every student stands
Create your first exam and watch the analytics build themselves. Free forever. No credit card needed.
Explore more features